
Duck hunters statewide eagerly anticipate the LDWF’s aerial waterfowl survey results each fall. Here’s a behind-the-scenes look at how the numbers get crunched — up in the air, and then down on the ground.
On a cool, crisp morning last January, Brian Dorsa pulled back on the stick of the Quest Kodiak 100 — and just like that, he was airborne, heading southwest toward Crowley at 190 mph.
He had departed from Baton Rouge’s Metro Airport earlier that morning with Larry Reynolds, the waterfowl study leader for the Louisiana Department of Wildlife and Fisheries, and had made a quick stop at the St. Landry Parish Airport near Opelousas to pick up biologists Jason Olszak and Austin Mouton and an observer
Blocks of agriculture fields, rural homes, crawfish ponds and small towns dotted the flat-as-a-pancake landscape on a bluebird day, and pretty quickly, the concrete expanse of I-10 was easily visible from the 2,000-foot cruising altitude.
Dorsa, 56, is the chief pilot for the LDWF’s Law Enforcement Division, but that day, his mission was for the birds — literally.
He was flying one section of the 27 Coastal Zone transect lines that make up the department’s annual January Waterfowl Survey. A cruise survey of Catahoula Lake also is part of the Coastal Zone estimates, which have been compiled every November, December and January going back to 1969. Dorsa also flies the annual teal survey, which comes out just before that season opens each September.
First up that day was Transect Line No. 12, which begins about 2½ miles west of Crowley near I-10 and extends due south all the way to the coast.
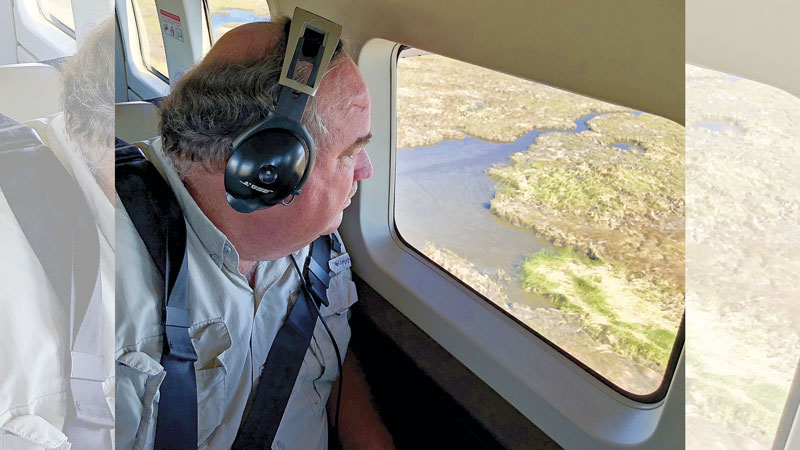
Reynolds watched out of the left side of the plane, while Olszak was responsible for the right. They were ready to go, each prepared to speak into a microphone connected to their laptops. Their color screens showed the transect lines and the plane’s position in real time, so they settled in as Dorsa eased the Kodiak onto the north end of Line 12. As the survey began, they were flying at about 100 mph — at an altitude of just 125 feet.
That’s when things started to get interesting.
Mission ‘impossible’
To the uninitiated, even attempting to count flocks of fast-moving ducks from a fast-moving airplane seemed like a daunting task. And the biologists are not just estimating numbers — they’re differentiating species as well.
Unlike hunters in a blind, their perspective is from above the birds looking down — so flight patterns and visual differences seen from ground level aren’t necessarily apparent from the air.
Throw in the fact that they’re sometimes looking at hundreds or thousands of birds in the air and on the water, with very little time to ponder the count and determine the species, and well … you get the idea.
It’s called an estimate for a reason.
“All of our survey data is wrong. Every single survey estimate is wrong,” Reynolds said later, chuckling. “They’re an underestimate — guaranteed. Because we just can’t see everything from the plane.”
Consistency is key
But he explained after the flight — and this is key — that exact numbers aren’t what’s important for the program. Rather, the value of each survey is that it happens on exactly the same transect lines in the same months, with very little turnover among the observers who count the ducks — year after year after year.
“What we’re looking at is changes — changes from month to month, and changes from year to year,” Reynolds said. “So, if we fly the survey the same way every time with the same people, then when I make an estimate of 2 million birds, does that mean there are 2 million birds there?
“No. No way, there’s more than that. But let’s say there were 3 million birds in the January 2018 survey and 2 million birds in January of 2019. The same guys in the same plane at the same time of the year flying the same transects using the same methods one year counted 3 million, and the next year counted 2 million. I am absolutely, 100% confident that we only had two-thirds the number of birds in 2019 that we had in 2018. But I am not confident at all that we had 2 million birds, or 3 million birds.
“The number itself is not meaningful — it’s the relationship of that number to the past.”

Ducks in decline
Unfortunately, those numbers in relation to the past don’t exactly paint a rosy portrait for ducks — or hunters — in the Bayou State.
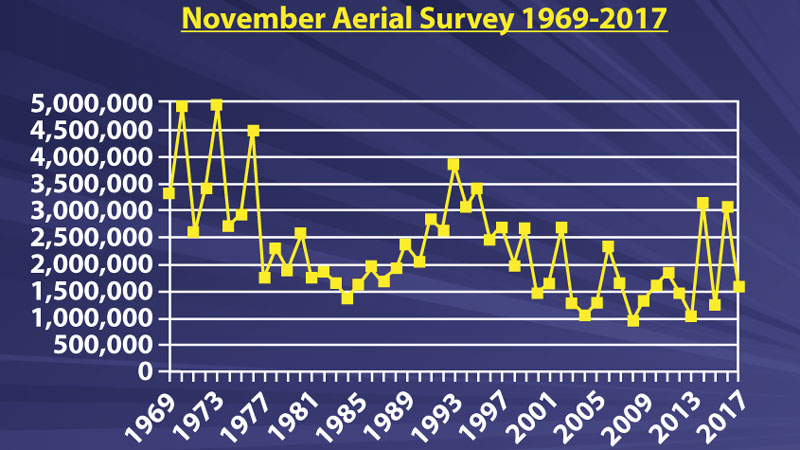
Since about the mid-1990s, the average number of birds counted in January’s survey has declined from a high of about 5 million down to 3 million. In November surveys, the high in the 90s was almost 4 million birds; in 2017, biologists counted fewer than half that number.
Mid-winter mallards in coastal Louisiana have declined from highs in the mid-1970s of more than 1 million birds to only about 100,000 earlier this year. Mid-winter pintails peaked at more than 900,000 around the year 2000; in 2019, fewer than 100,000 birds were counted. Mid-winter wigeon peaked at 600,000 birds in 1976. Since then, they’ve been in steep decline, with fewer than 15,000 counted last season.

Contributing factors
Reynolds thinks the precipitous decline can be attributed to a variety of factors, including warmer winters and more efficient rice production.
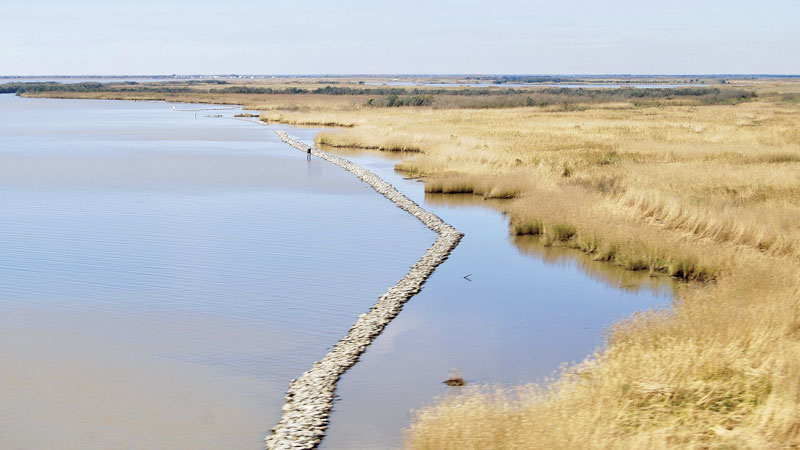
“In the 15 years that I’ve been flying the aerial surveys, I have seen a hugely noticeable increase in invasive aquatics covering prime duck habitats,” he said. “West of Highway 27, south of the Gibbstown Bridge and south of White Lake, there are now tremendous amounts of water hyacinth and salvinia that cover areas …. And we’re on the wrong end of climate change. We’re seeing warmer winters, deteriorating habitat conditions, invasive aquatics, less rice — and the rice we do see is providing less food because of the different varieties and the higher harvest efficiencies. Plus, a good portion of it is in crawfish. Even rice fields that in the past have provided better habitat for waterfowl, now when it goes into crawfish, they flood it deeper, and they’re disturbing it all the time. When I’m flying the survey and see those crawfish trails, I sit back and take a deep breath, because I know I’m not going to have any birds to count.”
Hurricanes also bear some responsibility for decimating coastal marshes in Southeast Louisiana, according to Reynolds, who flew his first survey shortly after Katrina hit in 2005.
“In the marsh south of New Orleans and east of the Mississippi River, Katrina busted it up, then Hurricane Gustav in 2008 washed it away. Since then, it’s just been continually getting more and more open water,” he said. “And you can see the number of ducks counted on those lines declining, and I know it’s because of the marsh destruction that started with Katrina, then Gustav helped it along — and it’s now more vulnerable.
“All of those things are leading to fewer ducks being counted on our surveys. It’s pretty depressing at times.”
Practice makes perfect
Just like hunters ready for the coming season by brushing blinds, repairing decoys and shooting skeet, Reynolds and Olszak also prepare for their time in the aircraft counting birds.
From September through January, they’ll spend about 12 days flying the 27 coastal transect lines, plus Catahoula Lake, for four total surveys. To get ready, they rely on software from a company called Wildlife Counts to make sure they’re prepared to make accurate estimates.
The practice software shows aerial photos of various species of birds, either in flight or on the water. Varying simulation scenarios can be selected for different skill levels, and the biologists put in lots of screen time to make sure they can identify a multitude of flock sizes — which isn’t exactly easy when you’re flying past at 100 mph.
“I start training on Sept. 1, and I will spend an hour a day on that software before I get in the plane for the teal survey,” Reynolds said. “I guarantee that when I’m done, I’ll have a printout from Wildlife Counts where my error rating is right around 5 to 7%, and that’s what I’m trying to do. But that’s just software.
“I would never be so arrogant to think my error rate will only be 5% out there in the wild where ducks are going in every direction, and flying at different angles. But on that computer, I’ve done my due diligence, and I have a really good idea of what 40 ducks looks like compared to 50 ducks, and 400 ducks compared to 500 ducks.”
Crunching the numbers
Flying the survey is just the first part of the process in preparing the actual estimates. The two biologists fly the 27 transect lines for each survey, recording their observations.
When he records, Reynolds notes the transect line number, the time and the particular habitat type of that portion of the line. It’s sort of controlled chaos, as he identifies species and estimates the count as the plane cruises.
A transcript of his observations on a recent flight from a sample of Transect Line 4 went like this:
“The time is 11:07. Habitat type is brackish marsh. Ring-neck ducks, four. Mottled ducks, six. Gadwall, 30. Mottled ducks, six. Green-wings, 40. Scaup, 22. Green-wings, 8. Green-wings, 130. Green-wings, 360. Gadwalls, 14. Mallards, six. Green-wings, 100. Now we’re in the intermediate marsh. Coots, 25. Shovelers, 40. Green-wings, 400. Mottled ducks, two. Coots, 50. Fifteen pintails. Gadwalls, eight. Scaup, 24. Mallards, 5. Hooded mergansers, four.”
Some sections of the lines feature intense action over great duck habitat. Others include subdivisions, roads, farms and small towns, with no ducks to be seen. That’s another key in providing a solid estimate, Reynolds said.
“It’s very important that the transect lines be random,” he said, “because if all you do is fly the good places, then your estimates will be through the roof because your transects are not representative of the rest of the habitat.”
Transect lines vary in length from 3 miles to more than 50. In southwest Louisiana, they’re 7½ miles apart. In southeast Louisiana, they’re 15 miles apart.
The rules
And there are rules for which birds on the lines get included in the counts. Using marks on the windows and struts of the plane, the biologists count birds only up to 200 yards away from the aircraft. Ducks beyond that mark aren’t included in the survey.
“So we’re basically covering a 400-yard swath,” Reynolds said. “The area of that 400-yard wide transect is approximately a random 3% of the total area. Thus, the number of ducks we see can be multiplied by 33 to get an estimate of the entire survey area in Southwest Louisiana.”

So if the two biologists actually count 3,000 mallards in southwest Louisiana, for example, that total survey number would become 99,000.
“In southeast Louisiana, those transect lines are 15 miles apart, and we’re doing approximately a 1.5% survey of all that area, so we multiply what we see by 72, and that allows us to get an estimate,” he said. “It’s just a geographically based estimate from the proportion of the habitat we fly relative to the total habitat in the survey area.”
So in southeast Louisiana, 3,000 mallards would become 216,000 birds for the survey.
Species ID
In addition to estimating numbers, they’re also identifying ducks by species, all in the short window of time as the plane flies.
Fortunately, in addition to visual observations, duck behavior also helps them make reliable species IDs.
“So there are times in November when you’re looking out, and there is a group of birds 180 yards from the plane, and they’re brown ducks sitting on the water,” Reynolds said. “And you’re like, ‘Are those pintails or gadwalls?’ I know they’re not green-wings, I know they’re not diving ducks, I know they’re not mallards … but I can’t tell if they’re pintail or gadwalls. And I literally hope one or 10 of them will get up and fly, because as soon as a gadwall gets up and flies, you see white in the speculum, and you can’t mistake it.
“But if it’s a big bunch of birds, I have to tell the pilot to bank around so we can check them out.
“For the January survey, the birds are plumed out with all their colors, so it’s easy to see what they are. But in November, a lot of the drakes don’t have any color, so it’s difficult to tell a pintail from a gadwall. So in November, three or four times a day, the pilot will bank around so we can speciate the birds we see. In January, that’s not so much of a problem.”
Reynolds said other species give tell-tale clues as to their ID by group behavior:
Blue-winged teal: “They flush from the plane sequentially. One will start, then the next group and the next group. But blue-wings are a piece of cake because of that big blue patch on the front of their wings.”
Green-winged teal: “Green-wings flush as a bunch. They look like a ball of bees that got up off the water all at the same time. That’s the first way you can tell green-wings immediately, aside from their size. They’re usually a dark group that gets up all at once.”
Shovelers: “They have that big blue patch on the top of their wings, and early-season drakes don’t have all that white. But they have a very distinctive triangular shape to their wings when they take off and fly away from you. You can’t mistake them at all.”
Ring-neck ducks vs. scaup: “Ring-neck ducks have dark sides, scaup have white sides. It’s very easy to tell from the air. And ring-neck ducks look like a black mass when they get up. They don’t have to splash across the water like scaup do — they can spring right into the air.”
Widgeon vs. gadwall: “I sometimes have trouble with widgeon because they have white on the shoulders, and gadwall have white in the speculum. But when you get a bunch of them that flush away from you, the white in the shoulders of the widgeon will catch your eye and give them away.”
Flyway flooding
No matter how many or how few birds Reynolds and his crew counts this season, Mother Nature will play a large role in how many ducks actually arrive in Louisiana, much less stick around for any period of time. How cold winter is in the Midwest, as well as habitat conditions here and elsewhere, all play a role in determining the number of ducks that will call Louisiana home for a few months during hunting season.
One thing is for sure: it’s been a very wet spring and summer up and down the flyway.
“There was just tremendous amounts of flooding,” Reynolds said. “There’s going to be a lot less grain grown up and down the flyway. The rest of the habitat — we don’t really know how good it’s going to be. But the habitat conditions for waterfowl north of Louisiana in the flyway should be poorer than last year.”
Duck production was relatively flat this spring. The U.S. Fish and Wildlife Service’s August breeding population numbers dipped slightly to almost 39 million birds.
“Populations of ducks don’t fluctuate from year to year — they tend to trend in a particular direction. And the trend right now is down, so the overall population was down another 6%,” Reynolds said.
And although overall pond numbers declined for this breeding season, Reynolds explained that wasn’t exactly bad news for Louisiana hunters this time around. Where the pond numbers actually declined is important, he said.
“Pond numbers may have been down overall, but they were up in the U.S. and down strongly in Canada. There was excellent water and excellent breeding ground conditions across the Dakotas and Minnesota. So there was really good breeding conditions at the southern end of the breeding grounds, but it was really dry at the northern end of the breeding grounds,” Reynolds said. “What tends to happen is when we have good duck populations settling out at the southern end of the breeding grounds … then production tends to be better. And so, what I’m hoping is that there will be excellent production at the southern end of the breeding grounds, which means more young ducks making it down the flyway — which will lend itself to better hunting success in the southern states.”
2019-20 season outlook
Reynolds hasn’t yet flown the November aerial survey, but he had completed the mid-September teal flights. He and Olszak estimated only 127,000 blue-wings, which is 45% below the long-term average of 230,000.
Habitat-wise, he thinks things have declined slightly compared to last year, due to long periods of high water this spring and summer.
“Across the coast, there has been a noticeable increase in water hyacinth and giant salvinia coverage,” Reynolds said. “Invasive aquatics are noticeably more abundant this year than they were last year.”
A big key for Louisiana duck hunters will be if better reproduction on the southern end of the breeding grounds up north actually translates into more birds for the Bayou State, he said.
“I want to be optimistic that things are going to be better than they were last year, and I’m almost certain that they will be unless we get a lot of flooding up and down the Flyway,” Reynolds said. “But the numbers from the BPOP survey don’t give us reason to be ecstatic about the upcoming season.
“It looks a lot like it did the year before, except for right now the habitat conditions north of us in the flyway may be more conducive for us to have better hunting.”


")