Use trail cams to identify patterns
In last month’s column we looked at some of the methods I typically use to convert my personal trail camera photo archives into meaningful and usable “deer statistics” or “intelligence.”
I am referring to the Webster’s Dictionary definition for “intelligence:” “the gathering of secret information.” If you are not already treating your personal stream of trail camera photos like CIA spy satellite photographs, you may want to reconsider the roll your photo data is currently playing in your hunting efforts.
Properly used trail camera data can become one of the most-effective tools in your toolbox, not only as a hunter but also as a deer manager. The trick is in learning a few basic steps that will help you convert your ever-growing collection of photos into meaningful predictions regarding deer movement patterns and tendencies on your own personal hunting property.
I have found on my property that, under certain weather conditions and levels of hunting pressure, deer movement does not always follow supposedly proven patterns.
From time to time we all read about proven patterns of deer movement. The studies that produce these “proven patterns” are, of course, based around scientifically controlled sets of circumstances and protocols that prevail at the time and specific location of each given deer movement study. These scientific studies are valid and very valuable, but information gleaned from them does not always extrapolate to all locales and to the unique conditions that prevail on each and every hunting property at any given time.
This is precisely why each of us should make an effort to glean everything that is actionable and useful from our trail camera photo data.
What you might find, as I did, is that deer movement in general and buck movement in particular on your property does not always follow established and generally accepted patterns.
Try and develop your own customized predictions through data gleaned from your trail camera photo collection.
Just for fun, let’s look at some of my personal findings and observations regarding buck movement suppressors and enhancers. The following observations I made were based on the 2008-09 deer season trail camera photo data on my personal property.
Scrape visits
Even though numerous scientific studies have shown that bucks primarily visit scrapes at night, my personal data indicated that the frequency of buck visitation to scrapes was split almost evenly between nighttime and daytime.
What was observed, though, was that a noticeable segment of the scrape-line buck movement, both day and night, involved bucks passing by an active scrape and scent-checking rather than working or marking the scrape.
Buck movement by time of day
My trail camera data regarding “buck observation data points” was converted from 12-hour time, as recorded, into 24-hour or military time. This process accumulated the data into one single batch of data points by the hour, resulting in 24 individual, hour-long segments from midnight to midnight.
In other words, the entire field of roughly five months of data points was compressed into one single 24-hour period for the purpose of showing relative buck movement by hour of day.
My primary focus was, of course, on the daytime segment of the data. See the accompanying chart.
Movement by moon phase
On my property, I could find no direct correlation between moon phase and buck movement over the time period that I studied.
If there was some minor moon-phase impact, it was either masked or neutralized in my data by a more-prominent factor such as weather conditions on a given day.
Temperature
Throughout the entire rut sequence, weather was found to be the single-largest factor impacting buck movement.
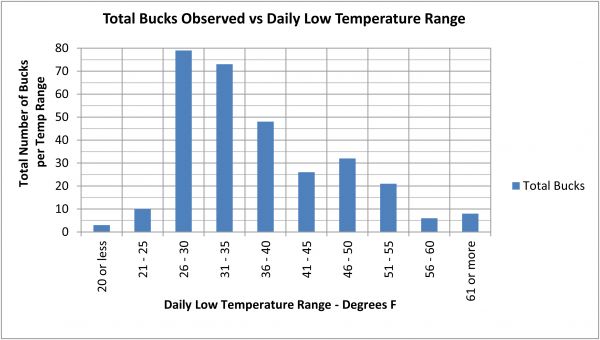
I compared daily buck movement with the corresponding daily low temperature, as recorded by the National Weather Service, and found that there was actually a prominent sweet spot for overall buck movement: Fully 50 percent of all observed buck movement occurred on days when the morning low ranged from 31 to 40 degrees, with 70 percent of all buck movement corresponding to days with a low temperature below 46 degrees.
I was quite surprised to find that on my property only about 4 percent of the observed buck movement occurred below 31 degrees. In other words, cool to cold mornings triggered good buck movement, but extreme cold had the opposite effect.I also found that only 5 percent of daily observed buck movement occurred on days with a low temperature reading of 61
degrees or higher.
Daily high temperature by itself was not found to be as useful as a predictor of buck movement as daily low temperature. See the accompanying chart.
Cloud Cover
Cloud cover, or lack thereof, equates roughly to barometric pressure level. On my property fully 62 percent of all observed buck movement activity occurred when daily average cloud cover ranged from 0 to 20 percent.
The overall best days to be in the field proved to be bluebird days following the passage of a cold front.
In conclusion, I cannot recommend strongly enough that all serious trail camera users experiment with some of the techniques that I have described. A well-maintained and organized archive of trail camera data derived from your property can prove to be absolutely dynamite when utilized properly.
I challenge readers to step outside the box and see what can be learned about deer and buck behavior on your property or lease.


")