
Spreadsheets can be used to track bucks
Common definitions of the word “statistics” are: 1) the mathematics of the collection, organization and interpretation of numerical data, or 2) the science that deals with the analysis and interpretation of numerical data.
The very mention of the words mathematics and numerical in the same sentence might make some reader’s eyes glaze over, but even if that is the case, keep reading. You will hopefully change your tune when you realize how simple it really is to turn piles of trail camera photographs into effective hunting strategies through basic statistics.
A group or collection of date- and time-stamped photographs becomes “numerical data” when it is gathered together and organized. Interpretation is the final step, but that is where the real “rubber meets the road.”
Statistical analysis of a collection of trail camera photos can range from simply making a mental or written note of where and when a particular buck moves on your property, all the way to entering the what, where and when information regarding buck movement into a computer spreadsheet.
The closer one gets to the later or spreadsheet side of the range, the more valuable the data becomes as a future predictor of deer or buck movement patterns during a season or from season to season.
Over the past several years, I have sliced and diced my personal trail cam photo collection to the point where I can now pretty accurately predict buck and overall deer movement patterns throughout the deer season as the rut, food availability and weather patterns ebb and flow.
By using the computer speadsheet format, I am able to easily sort and graph the data from my trail cam photo review, revealing patterns and tendencies of buck movement on my property. The variety of ways to sort and track my data is almost unlimited.
Look, even when you are armed with such valuable data, whitetails are still one of the wiliest and most cunning game species on the planet, and the deck will always be stacked against the hunter.
Case in point, more often over the years than I care to admit, I have targeted particular mature bucks, have acquired scores to sometimes hundreds of trail cam photos of those bucks across a season, and then have not even seen them once from a stand.
I need every edge that I can get in my quest for harvesting these old brutes. Deer statistics in the form of well-organized and easily accessed archives can be absolute dynamite in the hands of a hunter or property owner/manager, paying off not only in increased success and enjoyment but also in making informed management decisions.
Regarding trail cam photo review and analysis, I make a general assessment of each buck photographed, or more specifically each buck photo event.
I often use the burst mode on some of my cameras that are capable of recording multiple, sequential photos, typically three or four photos per burst, when the camera is triggered during each single “photo or buck event.”
When that is the case, each singular buck visit or camera encounter is counted as one “buck event,” without regard to the number of photos captured during a given encounter.
To translate my raw photographs into “deer statistics,” I take the information and data gleaned from the review process and input it into a computer spreadsheet program.
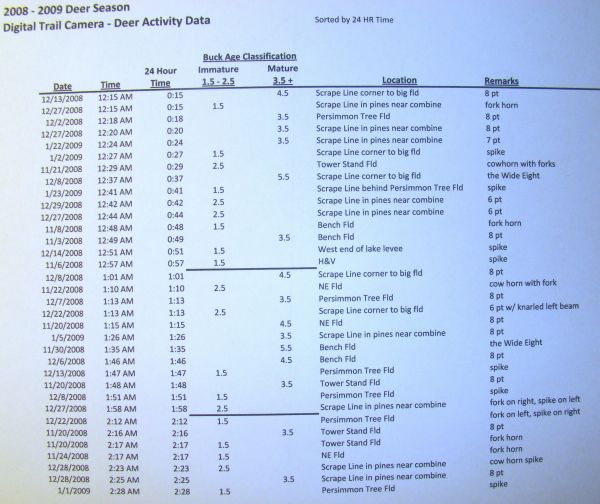
The typical basic data that I pull out of my trail cam photos for input into spreadsheets consists of the date, time, relative buck age, antler description and trail camera location for each buck photo event.
Regarding relative buck age class, the most accurate system for me has been to segregate the bucks into only two age classifications — “immature” for 1 ½- and 2 ½-year-old bucks, and “mature” for all bucks estimated to be 3 ½ years or older.
An attempt to break the age classification down further would introduce too much speculation and uncertainty into the data, since a collection of trail cam photos covers such a wide range of angles, distances and clarity from photo to photo.
You may choose to use additional age classifications based on your abilities and experience aging deer on the hoof, but if that is the case the inherent randomness of what you have to work with in trail cam photos will create a greater potential for error.
The number of ways to sort and track your trail cam photographic data are almost unlimited. I sort and graph my data in a number of ways:
The number of mature bucks or overall bucks photographed per 24 hour period or per week.
Mature bucks and overall bucks by movement during daytime versus nighttime. This can be done numerically or by percentage.
Mature buck or overall buck movement by time of day, as in total numbers photographed per hour from sunrise to sunset.
Mature buck or overall buck scrape line visits by time of day or night, and also total visits versus nighttime visits.
Mature buck and overall buck movement using parameters that can be obtained online from the National Weather Service archives in your area. I use weather parameters such as morning low-temperature range, afternoon high temperature, average percentage of cloud cover and average daily wind speed.
The buck movement trends that I have chronicled on my property over the past few years using this methods are quite interesting and have proven helpful time and time again during deer season.
Next month we will look at some of my personal trail cam photo data and what the data revealed when it was compiled, sorted and graphed.